
CIV-470 · Lesson 10 of 12 · 18 min
Floodplain mapping and flood risk management
Between Hillside Road and Ridgeway Road, Kestrel Creek winds through a floodplain about 300 ft wide. Upstream of the culvert, six houses, the operations center's north yard and a section of the co-op's water main sit on that floodplain, and the undersized culvert ponds water over them in large floods. The master plan must map the flood hazard, decide what may be built in the floodplain, and judge whether the works proposed in earlier lessons reduce the risk enough to justify their cost. This lesson moves from hydraulics to risk: the combination of how often floods happen, what they reach, and how much harm they do.
Hazard, exposure and vulnerability
Flood risk is commonly described as the product of three things. The hazard is the flood itself, its depth, velocity, duration and frequency at each location. Exposure is what lies in its path: people, buildings, roads, utilities, farmland. Vulnerability is how badly the exposed things are harmed by a given flood: a house with a basement suffers more than one on a raised slab, and a hospital matters more than a parking lot. Engineering works mostly reduce the hazard; land use planning reduces exposure; floodproofing, warning and insurance reduce vulnerability. A good plan uses all three.
Mapping the regulatory floodplain
Floodplain mapping turns the hydrology and hydraulics of CIV-370 into lines on a map. The regulatory flood flow is computed for the watershed, a hydraulic model, usually one-dimensional with HEC-RAS on a creek like this one, computes the water surface profile through surveyed cross-sections and the structures, and the resulting water levels are intersected with a digital elevation model from lidar to draw the flood line. The model is calibrated against observed high-water marks where they exist, and the sensitivity of the lines to roughness, flows and downstream water levels is tested.
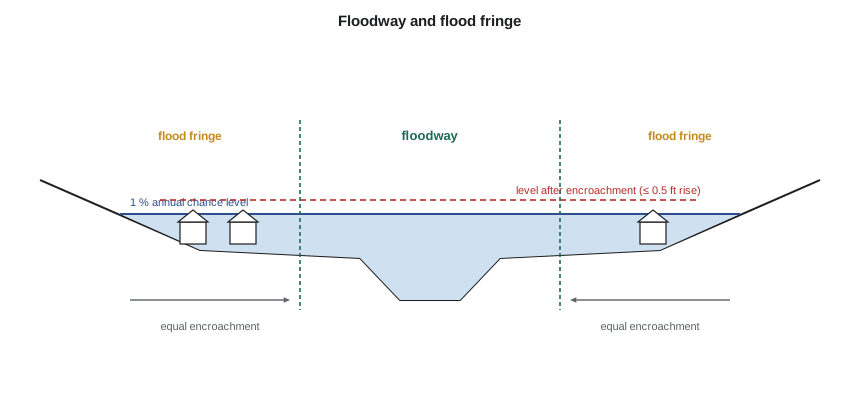
In the United States, floodplains are mapped under the National Flood Insurance Program, created in 1968. FEMA's Flood Insurance Rate Maps show the special flood hazard area, the area with a 1 % annual chance of flooding, and its base flood elevations; communities that join the program must regulate development there. A regulatory floodway is defined by encroaching equally from both sides of the floodplain until the 1 % flood rises by a set amount: the federal minimum is 1 ft, and Minnesota's floodplain rules limit it to 0.5 ft. Minnesota also requires the lowest floor of new buildings to be at least 1 ft above the regional flood profile, the regulatory flood protection elevation. Map changes go through letters of map revision, and a conditional letter is needed before works that would change the flood levels.
Encroachment and the floodway
Filling part of a floodplain removes conveyance and storage, so the flood must rise to pass the same flow. The floodway analysis asks how much of the floodplain can be filled before the rise becomes unacceptable. It is done by encroaching equally in conveyance from both sides, so that no landowner is favored, and recomputing the profile until the rise reaches the limit. The floodway is the area that must remain open; the flood fringe beyond it can be developed with buildings raised above the flood.
# Kestrel Creek floodplain: encroachment surcharge and expected annual damage
from math import sqrt
UNITS = "US"
SI = UNITS == "SI"
S = 0.004
BF = 0.85                            # bankfull depth of the main channel at the floodplain reach, m
def conveyance_depth(Q, left, right, nc=0.035, nf=0.060):
    # compound section: main channel b 3 m, z 2, depth BF to bankfull; flat floodplains of the given widths
    lo, hi = 0.05, 6.0
    for _ in range(80):
        y = (lo + hi) / 2
        yc = min(y, BF); Ac = yc * (3 + 2 * yc); Pc = 3 + 2 * yc * 5 ** 0.5
        Kc = Ac * (Ac / Pc) ** (2 / 3) / nc
        if y > BF:
            d = y - BF; Ac2 = (3 + 4 * BF) * d; Kc = (Ac + Ac2) * ((Ac + Ac2) / Pc) ** (2 / 3) / nc
            Kf = sum(w * d * (d) ** (2 / 3) / nf for w in (left, right))
        else: Kf = 0.0
        if (Kc + Kf) * S ** 0.5 > Q: hi = y
        else: lo = y
    return y
Q100 = 18.0
base = conveyance_depth(Q100, 40.0, 40.0)
print(f"100-year depth with the full floodplain (40 m each side): {base:.3f} m" if SI else
      f"100-year depth with the full floodplain (130 ft each side): {base/0.3048:.2f} ft")
allow = 0.30 if SI else 0.1524       # ca: 0.30 m screening limit; us: Minnesota floodway limit of 0.5 ft
for keep in (40, 20, 10, 5, 0):
    y = conveyance_depth(Q100, keep, keep)
    rise = y - base
    tag = "within" if rise <= allow else "exceeds"
    print(f"  keep {keep:2d} m each side: rise {rise:.3f} m ({tag} {allow:.2f} m)" if SI else
          f"  keep {keep/0.3048:3.0f} ft each side: rise {rise/0.3048:.2f} ft ({tag} 0.5 ft)")
# expected annual damage from a damage-frequency curve (trapezoidal integration over probability)
aep = [0.5, 0.2, 0.1, 0.04, 0.02, 0.01, 0.005, 0.002]
dmg_now = [0, 15, 60, 180, 320, 520, 760, 1100]          # thousand dollars, illustrative
dmg_new = [0, 0, 10, 40, 90, 190, 380, 800]              # after the culvert upgrade and berm
def ead(d):
    tot = sum((aep[i] - aep[i + 1]) * (d[i] + d[i + 1]) / 2 for i in range(len(aep) - 1))
    return tot + aep[-1] * d[-1]                         # rarer events counted at the last damage
e0, e1 = ead(dmg_now), ead(dmg_new)
r, nyr = 0.03, 50
pv = (1 - (1 + r) ** -nyr) / r
print(f"\nExpected annual damage: now {e0:.1f}, with the works {e1:.1f} thousand dollars per year")
print(f"Present value of avoided damage over {nyr} years at {r:.0%}: {(e0 - e1) * pv:,.0f} thousand dollars")
cost = 1250.0
print(f"Benefit-cost ratio against the full capital cost of {cost:,.0f} thousand dollars: {(e0 - e1) * pv / cost:.2f}")
extra = 380.0
print(f"Benefit-cost ratio against the extra cost of upsizing ({extra:.0f} thousand dollars), the crossing being replaced anyway: {(e0 - e1) * pv / extra:.2f}")100-year depth with the full floodplain (130 ft each side): 3.64 ft keep 131 ft each side: rise 0.00 ft (within 0.5 ft) keep 66 ft each side: rise 0.30 ft (within 0.5 ft) keep 33 ft each side: rise 0.62 ft (exceeds 0.5 ft) keep 16 ft each side: rise 0.91 ft (exceeds 0.5 ft) keep 0 ft each side: rise 1.48 ft (exceeds 0.5 ft) Expected annual damage: now 30.6, with the works 9.5 thousand dollars per year Present value of avoided damage over 50 years at 3%: 543 thousand dollars Benefit-cost ratio against the full capital cost of 1,250 thousand dollars: 0.43 Benefit-cost ratio against the extra cost of upsizing (380 thousand dollars), the crossing being replaced anyway: 1.43
Reading the results
With the full floodplain open, the 100-year depth in this reach is 3.6 ft. Filling the floodplain to leave 66 ft on each side raises it by 0.30 ft, within the state's 0.5 ft limit; leaving only 33 ft raises it by 0.62 ft, which exceeds it. The floodway for this reach is therefore about 130 ft wide plus the channel, and the flood fringe beyond it could be developed with lowest floors at least 1 ft above the regional flood plus the allowed rise. The rise is modest because the floodplain is shallow and rough, carrying a small share of the flow, but it matters to the houses already there.
Expected annual damage
Floods of different sizes cause different damage, and each has its own probability. The expected annual damage, the average damage per year over a long period, combines them by integrating damage over the annual exceedance probability:
Damage for each flood is estimated from the flood depth at each building with depth-damage curves, which give the damage to structure and contents as a function of depth relative to the main floor, plus damage to roads, utilities and the costs of emergency response and disruption. The EAD of the existing situation minus the EAD with a proposed work is the annual benefit of the work; its present value over the work's life, compared with the cost, gives the benefit-cost ratio.
Worked problem
Expected annual damage by hand
Three floods have annual exceedance probabilities of 0.10, 0.02 and 0.01 and cause damages of 60, 320 and 520 thousand dollars. Floods more frequent than 0.10 cause no damage, and rarer floods than 0.01 are taken at 520. Estimate the EAD.
Show solution
- From \(p = 0.10\) to \(0.02\): \(0.08 \times (60 + 320)/2 = 15.2\).
- From \(p = 0.02\) to \(0.01\): \(0.01 \times (320 + 520)/2 = 4.2\).
- Rarer than 0.01: \(0.01 \times 520 = 5.2\). Below 0.10, the damage falls from 60 to 0 between \(p = 0.10\) and some more frequent flood; assume \(p = 0.20\): \(0.10 \times 30 = 3.0\).
- \[\text{EAD} \approx 15.2 + 4.2 + 5.2 + 3.0 = 27.6\ \text{thousand dollars per year}\]
Answer: Frequent, moderate floods contribute as much to the average as rare, large ones, which is why the shape of the damage curve near the threshold matters.
For the floodplain upstream of Ridgeway Road, the code gives an EAD of about 30.6 thousand dollars a year now and 9.5 with the larger culvert of lesson 6 and a low berm protecting the operations center yard. Over 50 years at a 3 % discount rate, the avoided damage is worth about 543 thousand dollars. Against the full 1.25 million dollar cost of the new crossing, the benefit-cost ratio is only 0.43. But the crossing must be replaced anyway, for road safety, its age and fish passage, so the relevant cost is the extra cost of the larger box and the berm, about 380 thousand dollars, which gives a ratio of 1.43.
The comparison illustrates a general point: benefit-cost analysis must compare the right alternatives. Here the base case is not doing nothing; it is replacing the crossing at the minimum size, and the question is whether the extra capacity pays for itself.
| Annual exceedance probability | Return period (years) | Damage now ($k) | Damage with works ($k) |
|---|---|---|---|
| 0.20 | 5 | 15 | 0 |
| 0.10 | 10 | 60 | 10 |
| 0.04 | 25 | 180 | 40 |
| 0.02 | 50 | 320 | 90 |
| 0.01 | 100 | 520 | 190 |
| 0.005 | 200 | 760 | 380 |
| 0.002 | 500 | 1,100 | 800 |
Non-structural measures
Structures are not the only tools, and often not the best. Floodplain regulation keeps new development out of harm's way at almost no public cost. Buyouts remove the most exposed buildings, turning the land into parks that can flood safely; two of the six houses upstream of Ridgeway Road sit in the deepest part of the floodplain, and the plan offers voluntary purchase. Floodproofing raises buildings, seals basements, moves electrical panels and furnaces above the flood, and adds backflow valves. Flood forecasting and warning give residents time to move vehicles and belongings and to leave. Insurance spreads the cost of damage that cannot be avoided.
In the United States, flood insurance through the National Flood Insurance Program is required for buildings with federally backed mortgages in the special flood hazard area. Premiums are now set by FEMA's Risk Rating 2.0 method, which reflects each building's own flood risk, and communities can earn premium discounts for their residents through the Community Rating System by going beyond the minimum floodplain rules.
Residual risk
No measure removes flood risk entirely. A berm designed for the 100-year flood will be overtopped by a larger one, and the area behind it may then flood more suddenly and deeply than before, because people and buildings moved in when they felt protected. This residual risk must be communicated, mapped and planned for, with spillway sections in berms that overtop in a controlled way, warning, and emergency plans. The team's berm at the operations center yard has a lowered section that overtops first, away from the buildings, and the yard's emergency plan includes moving the fleet to higher ground when the creek reaches a trigger level.
Practical points
- Map the regulatory flood with a calibrated model and lidar terrain, and test the sensitivity of the lines.
- Determine the floodway by equal encroachment from both sides.
- Compute expected annual damage over the full range of floods, including frequent ones.
- Compare a work with the right base case, which may be a minimum replacement rather than doing nothing.
- Combine structural works with regulation, buyouts, floodproofing and warning, and plan for residual risk.
Common mistakes
MistakeComparing the full cost of a replacement crossing with its flood benefits alone.
InsteadIf the crossing must be replaced anyway, compare the incremental cost of the larger option.
MistakeComputing damage only for the 100-year flood.
InsteadFrequent floods contribute heavily to the expected annual damage.
MistakeEncroaching from one side to define a floodway.
InsteadEncroach equally from both sides so that the result is fair and consistent.
MistakeTreating land behind a berm as safe.
InsteadBerms can be overtopped or breached; residual risk must be mapped and managed.
Summary and key terms
- Flood risk combines hazard, exposure and vulnerability, and plans should reduce all three.
- FEMA maps the 1 % annual chance floodplain; Minnesota limits floodway encroachment to a 0.5 ft rise.
- Floodway analysis encroaches equally from both sides until the allowed rise is reached.
- Expected annual damage integrates damage over annual exceedance probability.
- The Kestrel Creek works cut EAD from about 30.6 to 9.5 thousand dollars a year; the incremental benefit-cost ratio is 1.43.
- Non-structural measures and planning for residual risk complete the plan.
- Regulatory flood
- The flood used to define the floodplain for land use regulation.
- Floodway
- The part of the floodplain that must remain open to pass the regulatory flood without an excessive rise.
- Flood fringe
- The part of the floodplain outside the floodway where development may be allowed with floodproofing.
- Annual exceedance probability
- The probability that a flood of a given size is equalled or exceeded in any year.
- Depth-damage curve
- A relation between flood depth at a building and the resulting damage.
- Expected annual damage
- The long-term average flood damage per year.
- Residual risk
- The risk that remains after flood protection measures, from larger floods or failures.
- Floodproofing
- Measures that reduce damage to individual buildings in floods.
Practice problems
Work each problem on paper first, then reveal the answer to check.
Damages are 0 at \(p = 0.5\), 100 at \(p = 0.1\) and 400 at \(p = 0.01\) (thousand dollars), and 400 for rarer floods. Estimate the EAD.
Show answer
\(0.4(50) + 0.09(250) + 0.01(400) = 20 + 22.5 + 4 = 46.5\) thousand dollars per year.
An annual benefit of 25 thousand dollars lasts 40 years at a 4 % discount rate. Find its present value.
Show answer
Present value factor \((1 - 1.04^{-40})/0.04 = 19.8\); \(25 \times 19.8 = 495\) thousand dollars.
Why is the floodway defined by equal encroachment from both sides?
Show answer
So that landowners on each side lose the same share of conveyance and no one gains at the other's expense.
Give two non-structural ways to reduce the flood risk to existing houses.
Show answer
Voluntary buyout of the most exposed houses and floodproofing, such as raising utilities and adding backflow valves, plus warning.
Lesson quiz · 5 questions
Score 60% or more to complete this lesson.
Create a free account to save your progress, take quizzes and earn a certificate.