
CHE-446 · Lesson 10 of 12 · 21 min
Sustainability and life-cycle assessment
One of the reasons Kingfisher Bioenergy is looking at ethyl acetate is that its version will be partly bio-based: the ethanol comes from the corn the plant already processes. Several of the coatings and pharmaceutical customers Malik has talked to want lower-carbon solvents, and some will pay a little more for them, provided the claim can be backed up. A claim of that kind needs numbers that will stand up to a customer's auditor. This lesson covers how those numbers are made: the carbon footprint of the product, the green chemistry metrics that describe how efficiently the process uses its materials, and the design choices that change both.
Life-cycle assessment
Life-cycle assessment, LCA, is a method for adding up the environmental effects of a product over its life, from the extraction of raw materials to disposal. The international standards ISO 14040 and ISO 14044 set out how to do it. An LCA has four phases. The goal and scope definition says what the study is for, what product system it covers and what the functional unit is, for example one metric ton of ethyl acetate at the plant gate. The inventory analysis lists every input and output of material and energy across the system. The impact assessment converts the inventory into effects such as climate change, acidification or water use. The interpretation draws conclusions, checks how sensitive they are to the assumptions, and says what the study can and cannot support.
The boundary of the study matters most. A cradle-to-gate study, which is what the ester line needs, covers everything from raw material extraction to the product leaving the plant. A cradle-to-grave study adds the use of the product and its disposal. For a solvent that evaporates during use in a coating, the end of life is the release of its carbon to the air as carbon dioxide once the vapor breaks down; whether that carbon is fossil or biogenic is the main difference between a petrochemical and a bio-based solvent over its whole life. Customers who want a cradle-to-gate figure will add their own use phase.
Allocation is the second difficult choice. When a process makes more than one product, its burdens must be shared among them. The ethanol plant makes ethanol, distillers grains sold as animal feed, and carbon dioxide sold to a gas company. How much of the farm's fertilizer, the plant's natural gas and its electricity belongs to the ethanol is a matter of method: by mass, by energy content, by economic value, or by system expansion, which credits the co-products with the burdens they avoid elsewhere. Different methods can change the ethanol's footprint by a third or more. Theo uses the figure the ethanol plant already reports for its fuel ethanol under the Renewable Fuel Standard and the 45Z credit, so that the ester's footprint is consistent with numbers the company already defends.
The carbon footprint of the ester
The carbon footprint, or carbon intensity, is the climate change result of an LCA, expressed in metric tons of carbon dioxide equivalent per metric ton of product. Greenhouse gases other than carbon dioxide, such as methane and nitrous oxide from farming, are converted to carbon dioxide equivalent with their global warming potentials. The ester's footprint has four main parts: the acetic acid, the ethanol, the steam used in the plant, and smaller items such as electricity, transport and catalyst.
GRID = 0.40   # t CO2e per MWh, Iowa grid average, illustrative
# Cradle-to-gate carbon intensity and green chemistry metrics for ethyl acetate (illustrative factors)
per_t = {'acid': 0.689, 'eth': 0.527}        # t raw material per t ester (lesson 3 yields)
ef = {'acid': 1.4,                           # t CO2e per t fossil acetic acid (methanol carbonylation), illustrative
      'eth': 0.9,                            # t CO2e per t of the plant's corn ethanol, illustrative
      'steam': 0.066,                        # t CO2 per GJ of steam from a gas boiler
      }
steam_GJ_t, power_MWh_t = 3.82, 0.035
parts = {'acetic acid': per_t['acid'] * ef['acid'], 'ethanol': per_t['eth'] * ef['eth'],
         'steam': steam_GJ_t * ef['steam'], 'electricity': power_MWh_t * GRID, 'transport and other': 0.05}
tot = sum(parts.values())
print("cradle-to-gate carbon intensity, t CO2e per t ethyl acetate")
for k, v in parts.items(): print(f"  {k:22s} {v:5.3f}  ({v/tot*100:4.1f} %)")
print(f"  total                  {tot:5.3f}")
fossil = 2.0                                 # illustrative petrochemical ethyl acetate made from fossil ethanol and acid
print(f"compared with an illustrative fossil route at {fossil:.1f}: {(1-tot/fossil)*100:.0f} % lower")
bio_acid = per_t['acid'] * 0.6               # acid made by bio-based routes, illustrative 0.6 t CO2e/t
print(f"with bio-based acetic acid at 0.6 t CO2e/t: total {tot - parts['acetic acid'] + bio_acid:.2f}")
# Green chemistry metrics
ester, water, waste = 2300.0, 472.0, 25.0       # kg/h product, co-product water, organics lost to treatment
inputs = 1585 + 1211 + 120                      # acid, ethanol, plus wash and stripping water and nitrogen, kg/h
print(f"\natom economy {88.11/(60.05+46.07)*100:.1f} %")
print(f"E-factor (organic waste only) {waste/ester:.3f} kg/kg; counting reaction water {(waste+water)/ester:.2f} kg/kg")
print(f"process mass intensity {inputs/ester:.2f} kg input per kg product")cradle-to-gate carbon intensity, t CO2e per t ethyl acetate acetic acid 0.965 (55.0 %) ethanol 0.474 (27.0 %) steam 0.252 (14.4 %) electricity 0.014 ( 0.8 %) transport and other 0.050 ( 2.8 %) total 1.755 compared with an illustrative fossil route at 2.0: 12 % lower with bio-based acetic acid at 0.6 t CO2e/t: total 1.20 atom economy 83.0 % E-factor (organic waste only) 0.011 kg/kg; counting reaction water 0.22 kg/kg process mass intensity 1.27 kg input per kg product
The code gives a cradle-to-gate carbon intensity of about 1.76 t CO₂e per metric ton of ester. More than half comes from the acetic acid, which is made from fossil methanol and carbon monoxide; just over a quarter from the ethanol; and about 14 % from the steam. Electricity is under 1 %, even though the plant draws on Iowa's grid, which mixes a large share of wind power with coal and natural gas and averages roughly 0.4 t CO₂e per MWh (illustrative), because the line uses so little power. The total is about 12 % below an illustrative figure of 2.0 for ethyl acetate made entirely from fossil feedstocks.
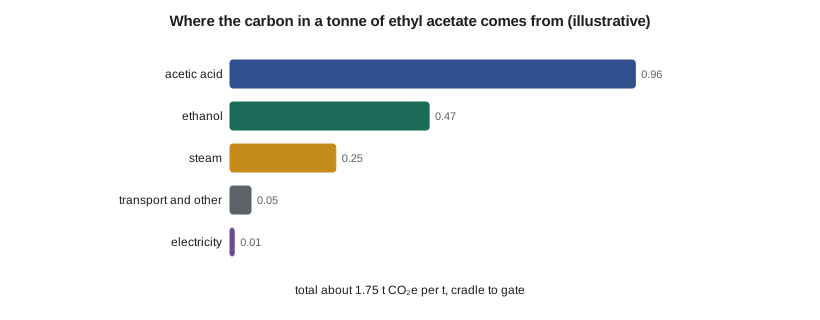
The result surprises the team. The bio-based ethanol, which is the selling point, contributes less than a third of the footprint, and the process itself, through its steam, less than a sixth. The largest single contributor is the acid, which the line buys. A reduction of 13 % is real but modest, and Malik is careful that the marketing claim matches it. The product is partly bio-based, with about half its carbon atoms coming from corn: two of the four carbon atoms in an ethyl acetate molecule come from the ethanol, and two from the acid. It is not carbon neutral, and the company will not call it so.
The numbers also show where to look for improvement. A supplier making acetic acid from biomass, or from methanol made with renewable hydrogen and captured carbon dioxide, could cut the acid's contribution sharply; at an illustrative 0.6 t CO₂e per metric ton of acid, the ester's footprint would fall to about 1.2, more than 40 % below the fossil route. That option is not available today at a competitive price, but it is a reason to keep the acid supply contract flexible. On the plant side, the MVR compressor from lesson 6 would replace about 0.9 MW of the 2.4 MW of steam, removing about 0.09 t CO₂e per metric ton of ester, a further 5 % reduction, at the cost of about 60 kW of electricity.
Worked problem
Footprint with MVR
The base footprint is 1.74 t CO₂e per metric ton, of which steam is 0.252. MVR cuts steam by 37 % and adds 60 kW of power for 8,400 h a year on 19,300 t of product. Grid intensity is 0.03 t CO₂e per MWh. What is the new footprint?
Show solution
- Steam saving \(= 0.37 \times 0.252 = 0.093\) t/t.
- Added electricity \(= 60 \times 8{,}400 / 19{,}300 = 26\) kWh/t, or 0.026 MWh/t.
- Added emissions \(= 0.026 \times 0.03 = 0.001\) t/t.
- New footprint \(= 1.74 - 0.093 + 0.001 = 1.65\) t/t.
Answer: About 1.65 t CO₂e per metric ton, about 5 % lower. On a grid at 0.4 t per MWh, the added power would cost about 0.01 t/t, and the saving would be slightly smaller.
Customers will ask how the claims are checked. The carbon footprint of a single product is covered by ISO 14067, which builds on the LCA standards and sets out how to report a product footprint, including how to treat biogenic carbon. The bio-based share can be measured directly rather than calculated: carbon from living plants contains a small, known amount of the radioactive isotope carbon-14, while carbon from fossil sources, millions of years old, contains essentially none. A laboratory test such as ASTM D6866 measures the carbon-14 in a sample and reports the bio-based carbon content. For the ester, it should come out close to 50 %. Dev adds the test to the laboratory's product quality plan, at a frequency of a few samples a year, because it is the simplest way to show that the ethanol in the product really came from the plant's corn and not from synthetic ethanol made from ethylene, bought in on a day the plant was down.
Theo also learns that a footprint is not fixed. The ethanol plant's own figure changes when it changes its energy supply, its yields or its farming sources, and the acid supplier's figure changes with its plant. The ester's footprint should therefore be updated each year from current data, in the same way the ethanol plant updates its fuel carbon intensity, and the report says so.
Green chemistry metrics
Carbon is one measure of environmental performance; the use of materials is another. Green chemistry offers several simple metrics. Atom economy, from lesson 2, is the share of the reactants' mass that ends up in the product if the reaction goes perfectly: 83 % for esterification, because the other 17 % leaves as water. The E-factor, introduced by Roger Sheldon, is the mass of waste per mass of product. Process mass intensity, PMI, is the total mass of all inputs per mass of product, including water and solvents, and is widely used in the pharmaceutical industry.
The ester line does well on all three. Its E-factor, counting only the organic losses sent to treatment, is about 0.01 kg per kg, very low by the standards of fine chemicals, where values of 5 to 50 are common, and typical of a well-integrated bulk process. Counting the reaction water as waste raises it to about 0.22, but that water is clean enough to reuse, as lesson 11 shows. The PMI is about 1.27, close to the theoretical minimum. These figures reflect the work done in lessons 2 and 3 to recover and recycle the unreacted feeds.
| Metric | Value | What it shows |
|---|---|---|
| Atom economy | 83 % | Water is the only by-product of the reaction |
| E-factor, organics only | 0.011 | Very little organic waste |
| E-factor, with water | 0.22 | Reaction water is the main waste stream |
| Process mass intensity | 1.27 | Inputs are close to the minimum |
| Carbon intensity | 1.76 t CO₂e/t | Mostly from purchased acid |
Other impacts and trade-offs
A complete LCA would cover more than carbon. The corn behind the ethanol uses land, water and fertilizer, and its nitrogen runoff affects rivers and lakes; the acid is made from natural gas or coal. Water use at the ester line is small, mostly cooling tower make-up. Air emissions are mainly the volatile organic compounds vented from tanks and loading, which lesson 11 covers. Theo's report includes the carbon footprint in detail and the other impacts qualitatively, with a recommendation that a full third-party LCA be commissioned before the product is marketed with a specific claim.
Sustainability choices often trade against cost. The MVR compressor cuts emissions and steam cost but adds capital. Bio-based acid would cut emissions sharply but costs more today. A smaller storage inventory, lesson 11's proposal, cuts both cost and risk. Ingrid asks Theo to show each option's effect on both NPV and carbon intensity side by side in the final report, so that Kingfisher's board can see what each metric ton of carbon saved would cost or earn. In Iowa, there is no carbon price, so the value of the steam saving is the steam cost alone, plus whatever premium customers will pay.
Common mistakes
MistakeCalling a partly bio-based product carbon neutral.
InsteadState the cradle-to-gate footprint and the bio-based carbon share.
MistakeAssuming the bio-based feed dominates the footprint.
InsteadHere, the purchased acid is the largest contributor.
MistakeIgnoring allocation choices for co-products.
InsteadState the method; it can change the result by a third or more.
MistakeUsing an E-factor without saying what counts as waste.
InsteadReport with and without water.
MistakeTreating carbon as the only impact.
InsteadLand, water, nutrients and air emissions matter too.
Summary and key terms
- LCA under ISO 14040 and 14044 has four phases: goal and scope, inventory, impact assessment and interpretation.
- The ester's cradle-to-gate footprint is about 1.76 t CO₂e per metric ton, about 12 % below an illustrative fossil route.
- Purchased acetic acid is more than half the footprint; bio-based acid could cut the total by more than 40 %.
- MVR would cut the footprint by about 5 %.
- Atom economy is 83 %, E-factor about 0.01 and PMI about 1.27.
- Life-cycle assessment
- A method for adding up the environmental effects of a product over its life.
- Functional unit
- The reference quantity of product or service that an LCA describes.
- Cradle to gate
- A boundary from raw material extraction to the product leaving the plant.
- Allocation
- The sharing of burdens among the co-products of a process.
- Carbon intensity
- Greenhouse gas emissions per unit of product, in CO₂ equivalent.
- E-factor
- Mass of waste per mass of product.
- Process mass intensity
- Total mass of inputs per mass of product.
Practice problems
Work each problem on paper first, then reveal the answer to check.
What functional unit suits the ester study?
Show answer
One metric ton of ethyl acetate at the plant gate.
Which part of the footprint is largest?
Show answer
The purchased acetic acid, about 0.97 t CO₂e per metric ton of ester.
What share of the ester's carbon atoms comes from ethanol?
Show answer
Half: two of four.
Why does allocation matter for the ethanol?
Show answer
The ethanol plant has co-products, and the method changes how much burden the ethanol carries.
What is the E-factor if the reaction water is counted?
Show answer
About 0.22.
What would bio-based acid at 0.6 t CO₂e per metric ton do to the total?
Show answer
Reduce it to about 1.2.
Lesson quiz · 5 questions
Score 60% or more to complete this lesson.
Create a free account to save your progress, take quizzes and earn a certificate.