
MEC-430 · Lesson 11 of 12 · 19 min
Energy codes and building energy simulation
Design loads size equipment, but the owner pays for energy, and the energy code regulates it. This lesson explains how energy codes for commercial buildings work, which code governs the health center, how compliance is shown, and how annual energy is estimated, from the simple degree-day method to hourly simulation. The program runs a small hourly simulation of the building's heating and tests a set of energy conservation measures.
How energy codes work
Commercial energy codes regulate the envelope, the HVAC systems, service water heating, lighting and electrical power. Most offer two paths. The prescriptive path sets requirements component by component: maximum U-values for walls, roofs and windows, minimum equipment efficiencies, fan power limits, required controls such as economizers, setback and demand-controlled ventilation, and limits on the window-to-wall ratio. A building that meets every prescriptive requirement complies. The performance path allows trade-offs: the designer models the proposed building and a reference or baseline building that just meets the prescriptive requirements, and shows that the proposed design uses no more energy, or no more energy cost, than the reference. Trade-offs let a building with, say, more glass compensate with better heat recovery.
For this building the governing code is the Minnesota Energy Code, whose commercial provisions adopt ASHRAE/IES Standard 90.1-2019 with Minnesota amendments and came into force on January 5, 2024. Standard 90.1-2022 is the current national edition and the 2024 International Energy Conservation Code is the current model code, and Minnesota law passed in 2023 directs successive updates of the commercial code toward much larger energy reductions by 2036, so later editions will be stricter. The hospital's own policy requires the building to perform substantially better than the code minimum, and the team uses the performance path to show it.
| Element | Typical prescriptive approach | Health center design |
|---|---|---|
| Opaque walls | maximum effective U-value by climate zone | 0.21 W/m²K effective |
| Windows | maximum U-value and window-to-wall ratio | 1.60 W/m²K, 35 % of wall |
| Energy recovery | required above outdoor air thresholds | enthalpy wheel, 0.70 |
| Fan power | limit in watts per unit airflow | about 1.7 W per L/s for the DOAS |
| Controls | setback, optimal start, resets, DCV | Guideline 36 sequences |
| Heating and cooling plant | minimum efficiencies | district connection, treated per code rules |
District energy in energy codes
A building that buys heat and cooling from a district system has no boilers or chillers whose efficiency can be checked, and codes need a rule for comparing it with a reference building that has its own plant. The approaches differ between codes and editions, but the common idea is that the district energy is either converted to an equivalent on-site source at a specified efficiency, or the reference building is given the same district supply. Kofi, who has done this before for Northgate's customers, follows the code's own rules and the authority's published guidance, and documents the method in the compliance report, because it is the first thing a reviewer will question.
Estimating annual energy: degree-days
The simplest annual estimate uses heating degree-days. If a building loses heat at a rate UA per kelvin and has a balance point temperature below which it needs heating, the annual heating energy is UA times the degree-days below the balance point times 24 hours. Published degree-days are usually to base 18 °C, or 65 °F; the true balance point is lower because internal and solar gains supply part of the loss, which is why degree-day estimates are often corrected by a factor. The method is quick and useful for checking orders of magnitude, but it ignores schedules, setback, the timing of gains, ventilation that runs only when the building is occupied, and the way systems behave at part load.
Bin methods and hourly simulation
The bin method improves on degree-days by grouping the hours of a typical year into temperature bins, 5 K wide for example, and calculating the load and system performance for each bin, separately for occupied and unoccupied hours. It captures part-load behavior and schedules reasonably well and can be done in a spreadsheet. Hourly simulation goes further: it calculates the building's loads and systems for each of the 8,760 hours of a typical weather year, with the thermal mass, schedules, controls and equipment curves. Programs such as EnergyPlus, developed for the US Department of Energy and freely available, and commercial tools built on it or on other engines, are used for code compliance and design decisions. Typical-year weather files are constructed from long records to represent average conditions; they are not suitable for checking peak loads.
# Annual heating energy: degree-day estimate versus an hourly simulation on a synthetic typical year
import math, random
SITE = 'us'
d = {'ca': dict(city='Winnipeg', mean=2.8, amp=18.5, hdd_pub=5670), 'us': dict(city='Minneapolis', mean=7.8, amp=16.5, hdd_pub=4250)}[SITE]
random.seed(430)
temps, w = [], 0.0                                   # synthetic hourly outdoor temperatures (a teaching data set)
for hr in range(8760):
    day = hr/24.0; w = 0.97*w + random.gauss(0, 0.95)          # weather swings lasting several days
    t = d['mean'] - d['amp']*math.cos(2*math.pi*(day - 20)/365) + 4.5*math.cos(2*math.pi*((hr % 24) - 15)/24) + w
    temps.append(t)
hdd = sum(max(0, 18 - t) for t in temps)/24
print(f"{d['city']} synthetic year: mean {sum(temps)/8760:.1f} C, minimum {min(temps):.1f} C, HDD18 {hdd:.0f} "
      f"(published normal about {d['hdd_pub']})")
UA = 2431.0                                          # W/K envelope + infiltration (lesson 4)
area, c, oa = 6000.0, 1.21, 4.5
def simulate(UA=UA, eff=0.70, setback=True, usable=0.35):
    # only part of the internal and solar gain offsets perimeter losses; the rest lands in interior zones that need cooling
    q_total = 0.0
    for hr, t in enumerate(temps):
        dow, h = (hr // 24) % 7, hr % 24
        occ = dow < 5 and 7 <= h < 19 or dow == 5 and 8 <= h < 13
        ti = 22.0 if occ or not setback else 18.0
        internal = usable*(400*75*0.7 + 16*area*0.9) if occ else 0.15*16*area
        solar = usable*max(0.0, 25000*math.sin(math.pi*(h - 6)/12)) if 6 < h < 18 else 0.0
        q = UA*(ti - t) - internal - solar
        if occ:
            trec = t + eff*(22 - t)
            q += 1000*c*oa*max(0.0, 18 - trec)
        q_total += max(0.0, q)
    return q_total/1e6                               # MWh
base = simulate()
print(f"Hourly simulation, base design: {base:.0f} MWh/yr = {1000*base/area:.0f} kWh/m2 of heating")
dd_est = UA*24*hdd/1e6*0.8
print(f"Degree-day estimate of envelope heating only, 0.8 correction for gains: {dd_est:.0f} MWh")
print(f"  (the simple estimate leaves out ventilation, setback and the timing of gains)")
for name, kw in (('no night setback', dict(setback=False)), ('energy recovery 0.80', dict(eff=0.80)),
                 ('triple glazing, U 1.0', dict(UA=UA - 941*0.6)), ('no energy recovery', dict(eff=0.0))):
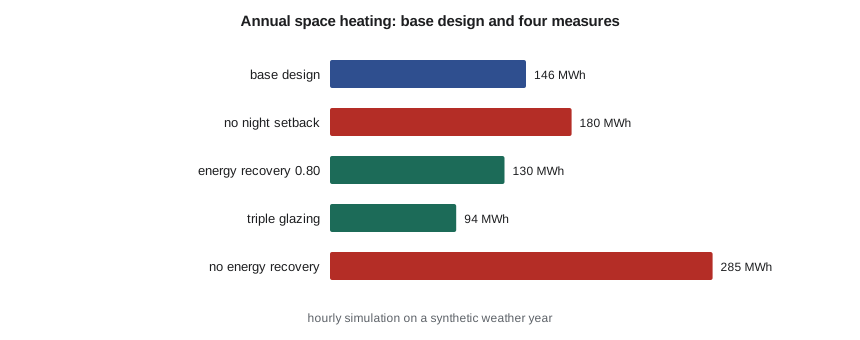
r = simulate(**kw); print(f" {name:22s}: {r:5.0f} MWh ({100*(r - base)/base:+.0f} %)")Minneapolis synthetic year: mean 8.7 C, minimum -21.2 C, HDD18 4049 (published normal about 4250) Hourly simulation, base design: 146 MWh/yr = 24 kWh/m2 of heating Degree-day estimate of envelope heating only, 0.8 correction for gains: 189 MWh (the simple estimate leaves out ventilation, setback and the timing of gains) no night setback : 180 MWh (+23 %) energy recovery 0.80 : 130 MWh (-11 %) triple glazing, U 1.0 : 94 MWh (-35 %) no energy recovery : 285 MWh (+96 %)
Reading the result
The program builds a synthetic year of hourly temperatures for Minneapolis from the city's mean and seasonal swing with random weather variations, a teaching data set that reproduces the published heating degree-days to within a few percent. It then steps through the year with the building's envelope from Lesson 4, the clinic schedule, night setback, internal and solar gains and the DOAS with energy recovery running only when the building is occupied. Only part of the internal and solar gain is counted as reducing the perimeter heating, because much of it lands in interior zones that need cooling even in winter. The base design uses about 146 MWh of space heating a year, about 24 kWh per square meter. The figure excludes service water heating and the imaging suite, which a full model would include.
The measures show where the energy goes. Removing night setback adds 23 percent. Raising the recovery effectiveness from 0.70 to 0.80 saves 11 percent. Triple glazing with a U-value of 1.0 saves about a third, more than any other measure, which agrees with the design load breakdown in Lesson 4. Removing energy recovery would raise the heating energy by 96 percent: in this building the wheel is not an option but a necessity. The degree-day estimate of envelope heating alone gives a number of the right order, but it says nothing about these measures because it cannot represent ventilation schedules, setback or the timing of gains.
Trade-offs in practice
The measures in the program are typical of the decisions the performance path is used for. The architect would like a little more glass on the community room facade facing the river; the mechanical team would like better heat recovery and lower fan power; the cost consultant would like to drop the triple glazing. Each proposal can be tested with the same model, and the compliance margin, the difference between the proposed and reference results, is the currency in which they are traded. A good team agrees early on how much margin to keep in reserve for changes during construction, because a building that complies by a hair at design development usually fails to comply by the time the last value-engineering change has been made.
Energy measures also interact. Better glazing reduces the heating load, which reduces the value of better heat recovery; better heat recovery reduces the ventilation load, which reduces the value of demand-controlled ventilation. Adding up the savings of measures tested one at a time overstates the combined saving. The model is run with the chosen package as a whole before anyone reports a total, and the hospital's board is shown the package result, not the sum of the parts.
Using simulation well
Energy models are powerful and easily misused. The commonest errors are inputs: schedules that assume the building is empty at night when the urgent care unit is open, equipment densities from nameplates, infiltration rates borrowed from another building, and controls modeled as ideal when the real sequences will be less so. A model calibrated to nothing is a hypothesis. For design decisions, comparisons between options using the same model and inputs are far more reliable than absolute predictions, because many errors cancel. For compliance, the code's modeling rules, which specify how the reference building is built and which inputs must match, take precedence over the modeler's preferences.
A growing number of owners also set targets for energy use intensity, annual energy per square meter, and for carbon. The hospital has set a target for the health center's total site energy use intensity and for its operational carbon, and Kofi's model reports both. After occupancy, the building's actual use will be compared with the model and with Northgate's meter data, and differences will be investigated; the model's assumptions, recorded in the basis of design, make that investigation possible.
Worked problem
A degree-day estimate
A building has UA = 2,431 W/K for envelope and infiltration. Using 4,250 heating degree-days to base 18 °C and a correction factor of 0.8 for internal gains, estimate the annual envelope heating energy.
Show solution
- \(E = 2431 \times 24 \times 4250 \times 0.8 = 198.4 \times 10^6\) Wh.
- That is about 198 MWh a year, or 33 kWh per m² over 6,000 m².
Answer: The estimate is of the right order but leaves out ventilation, setback and the real timing of gains; the hourly simulation is needed to test design measures.
Common mistakes
MistakeUsing the prescriptive path without checking that every requirement is met.
InsteadCheck each requirement, or use the performance path with documented trade-offs.
MistakeAssuming a district-connected building's plant efficiency is not addressed by the code.
InsteadFollow the code's specific rules for district energy and document them.
MistakeUsing a typical-year weather file to check peak loads.
InsteadUse design conditions for peaks and typical years for annual energy.
MistakeTreating an uncalibrated model's absolute result as a prediction.
InsteadUse models mainly to compare options with consistent inputs.
MistakeCopying schedules and densities from a template.
InsteadUse the building's real hours, occupancy and measured equipment gains.
Summary and key terms
- Energy codes offer a prescriptive path and a performance path with a reference building.
- The health center must meet the Minnesota Energy Code, based on ASHRAE 90.1-2019.
- Degree-day estimates check magnitudes; bin methods and hourly simulation capture schedules and part load.
- The hourly model gives about 146 MWh, or 24 kWh/m², of space heating in Minneapolis's climate.
- Triple glazing saves about a third; removing energy recovery would raise heating by 84 to 96 percent.
- Models are most reliable for comparing options with consistent inputs.
- Prescriptive path
- Code compliance by meeting each component requirement.
- Performance path
- Code compliance by showing modeled energy no greater than a reference building's.
- Reference building
- A model of the proposed building that just meets the prescriptive requirements.
- Heating degree-days
- The sum over a year of the amount by which the daily mean temperature falls below a base temperature.
- Balance point temperature
- The outdoor temperature below which a building needs heating.
- Bin method
- An energy estimate made by calculating performance for groups of hours in temperature bins.
- Typical weather year
- A year of hourly weather data assembled to represent long-term average conditions.
- Energy use intensity
- Annual energy use per unit floor area.
Practice problems
Work each problem on paper first, then reveal the answer to check.
A building with UA = 3,000 W/K sees 5,000 degree-days. Estimate its uncorrected annual heating energy.
Show answer
\(3000 \times 24 \times 5000 = 360\) MWh.
Why is the true balance point below 18 °C in most commercial buildings?
Show answer
Internal and solar gains supply part of the heat loss.
What is the main difference between the prescriptive and performance paths?
Show answer
The performance path allows trade-offs shown by comparison with a reference building.
In the program, what does an energy recovery effectiveness of 0.60 do to the base result?
Show answer
It raises heating energy, by roughly 10 to 12 percent.
Why are energy model comparisons more reliable than absolute predictions?
Show answer
Many input errors affect both options similarly and cancel in the difference.
Lesson quiz · 5 questions
Score 60% or more to complete this lesson.
Create a free account to save your progress, take quizzes and earn a certificate.