
HSE-375 · Lesson 5 of 12 · 20 min
Safety program certification, EMR and injury rates
When Cottonwood Place Developments invited contractors to bid on Cottonwood Place, its prequalification form asked each bidder for its experience modification rate (EMR) for the past three years, its OSHA 300A summaries, its total recordable incident rate and a copy of its written safety program. Bidders with an EMR above 1.0 had to explain why. Two of the seven firms that asked for the documents did not return the form. Tallgrass's safety numbers are part of how it wins work, and they are also one of the ways it finds out whether its program is working.
This lesson looks at how safety programs are certified and measured, what the numbers mean and do not mean, and how Tallgrass uses the same measures when it chooses its subcontractors.
Certifying a safety program
There is no single national certificate for construction safety programs in the United States. Several systems are used instead. OSHA's Voluntary Protection Programs (VPP) recognize worksites with exemplary safety management systems after an on-site evaluation, and the related Safety and Health Achievement Recognition Program (SHARP) recognizes small businesses that work with their state's free on-site consultation program. Some contractors certify their safety management system to ISO 45001, the international standard for occupational health and safety management systems. Most often, owners and general contractors rely on prequalification platforms, where contractors upload their programs, training records, insurance and injury data for review against the client's criteria.
OSHA VPP sites are evaluated on management leadership and worker involvement, worksite analysis, hazard prevention and control, and safety and health training, and they must have injury rates below their industry's average. Sites in VPP are removed from OSHA's programmed inspection lists, although OSHA still investigates complaints and serious incidents. ISO 45001 certification is carried out by accredited third-party certification bodies, with surveillance audits each year and recertification every three years. Prequalification platforms each have their own scoring, usually combining program review, EMR, injury rates and citation history.
Whichever system is used, the auditors look at similar things: management commitment, worker involvement, hazard identification and control, training, inspections, incident investigation, emergency preparedness and records. The interviews matter: an evaluator who finds a perfect manual but workers who cannot describe the company's hazard analysis process will mark the system down.
The experience modification rate
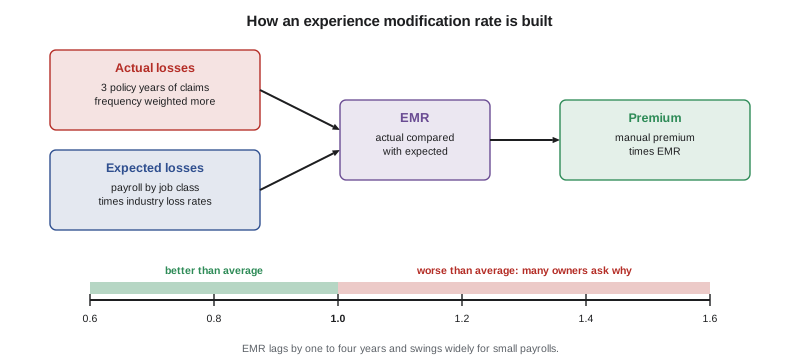
Workers' compensation insurance premiums in most states, including Texas, are adjusted by an experience modification rate calculated by the National Council on Compensation Insurance (NCCI) or a state rating bureau. The EMR compares an employer's actual claim losses over three policy years, usually ending a year before the current one, with the losses expected for employers of its size in the same job classifications. An EMR of 1.0 is average. An EMR of 0.80 means losses 20 percent below expected, and the premium is reduced by 20 percent; an EMR of 1.25 increases it by 25 percent. The formula gives more weight to how often claims happen than to how large they are, so many small claims raise an EMR more than one large one. Owners and general contractors use EMR as a quick screen, and many will not accept bidders above 1.0 without an explanation.
What EMR does and does not tell you
An EMR is useful but crude. It lags by one to four years, so it reflects the company's past more than its present. It depends on payroll, so small firms' EMRs swing widely after a single claim. It is affected by how well claims are managed, not only by how many injuries occur. And it can be distorted when claims are not reported, which is exactly the behavior a safety program should prevent. Tallgrass treats an EMR above 1.0 as a reason to ask questions, and an EMR below 1.0 as a reason to look at the program, not as proof of safety.
Injury rates
Injury rates let companies of different sizes compare their records. The two most common in the United States come from the OSHA 300 log. The total recordable incident rate (TRIR) is the number of recordable injuries and illnesses multiplied by 200,000 and divided by the total hours worked by all employees. The 200,000 figure represents 100 full-time employees working 40 hours a week for 50 weeks. The DART rate uses the same formula but counts only cases with days away from work, restricted work or job transfer. The Bureau of Labor Statistics publishes industry averages that companies use as a benchmark.
Owen calculates Tallgrass's rates for Cottonwood Place each month and compares them with the company's three-year average.
# Injury rates for the Tallgrass workforce on Cottonwood Place, year to date.
hours = 186_400          # hours worked by Tallgrass employees
recordable = 3           # medical aid + modified work + lost time cases
lost_time = 1            # cases with days away from work
restricted = 1           # cases with restricted work or transfer
base = 200_000
trif = recordable * base / hours
ltif = lost_time * base / hours
dart = (lost_time + restricted) * base / hours
print(f"total recordable rate: {trif:.2f}")
print(f"lost time rate:        {ltif:.2f}")
print(f"days away/restricted:  {dart:.2f}")
print(f"rule of thumb: one case adds {base / hours:.2f} to each rate at this size")total recordable rate: 3.22 lost time rate: 1.07 days away/restricted: 2.15 rule of thumb: one case adds 1.07 to each rate at this size
The last line of the output is the reason Owen is careful with these numbers. For a workforce of this size, a single injury moves the total recordable rate by more than 1. A low rate over a few months says little about whether serious injuries are being prevented; it may just be luck.
Leading and lagging indicators
Injury rates, compensation rates and EMR are lagging indicators: they measure harm after it has happened. Good programs also track leading indicators, which measure the activities that prevent harm. On Cottonwood Place, Owen's monthly report put both on the same page.
| Indicator | Type | What it shows | Cottonwood Place target |
|---|---|---|---|
| Total recordable rate | Lagging | How often injuries needing more than first aid occur | Below the company three-year average |
| EMR | Lagging | Claim costs compared with peers | Below 1.0 |
| Planned inspections completed | Leading | Whether hazards are being looked for | 100 percent |
| Deficiencies closed on time | Leading | Whether hazards are being fixed | 90 percent or more |
| Near misses reported per month | Leading | Whether workers trust the reporting system | Rising, then steady |
| Pre-task plans reviewed by a supervisor | Leading | Whether planning is real | Weekly sample of 10 |
| Serious injury and fatality potential events | Lagging and leading | Close calls that could have killed someone | Every one investigated |
A rising count of near-miss reports is usually good news in the first months of a project: it means workers trust that reporting leads to fixes rather than blame. A sudden drop with no change in conditions is a warning sign that people have stopped reporting.
When numbers are managed instead of hazards
Any number that is used to award contracts or bonuses will be managed. Some companies have been found to discourage injury reporting, to pressure injured workers to return to light duty the same day to avoid a lost time case, or to treat injuries with first aid when medical care was needed. Those practices harm workers and break the law in both countries. Tallgrass bases supervisors' safety bonuses on leading indicators, such as inspections and deficiency closure, and never on injury counts, and it audits its injury records against first aid logs and the site's daily reports.
Worked problem
Using EMR and rates in subcontractor selection
Show solution
- Tallgrass received three bids for the drywall and ceiling package: Pinecrest Interiors LLC, and two others.
- Pinecrest reported an EMR of 1.18 and a TRIR of 6.4, against 0.86 and 0.92 EMRs and TRIRs near 3 for the others, and had received two serious OSHA citations for fall protection the previous summer.
- Tallgrass's prequalification flags any EMR above 1.0 for review. Pinecrest explained that one large claim and a period of rapid growth had driven its numbers, and it submitted a corrective action plan.
- Pinecrest's price was lowest, and it was the only firm with crew available on the schedule. Tallgrass awarded it the work with conditions: a written fall protection plan for openings, a full-time foreman on site, and a monthly safety review with Owen.
- The level 5 fall in lesson 1 happened in the fourth month. The conditions gave Tallgrass a clear basis to require further changes.
Answer: Certification and rates are screens, not guarantees; conditions attached to a contract turn a warning sign into a plan.
Reading a safety record properly
When Owen reviews a subcontractor's numbers, he asks four questions before he draws any conclusion. First, how many hours are behind the rate? A firm with 40,000 hours a year can go from a perfect record to a poor one with a single injury, so he looks at three years together rather than one. Second, how serious were the injuries? Three minor recordable cases are a different story from one amputation, even if the rate looks better. Third, what kind of work produced them? A drywall firm's injuries should be compared with drywall firms, not with electricians. And fourth, what has changed since? A firm that had a bad year, investigated it honestly and changed its practices may be a better choice than one with a clean record and no system for learning.
He also looks at the enforcement history in the same way. An other-than-serious citation for a missing poster is not the same as a willful citation for workers in an unprotected trench. OSHA's establishment search shows each inspection, the standards cited, the classification and the outcome after any settlement, so Owen can see whether a firm's description of its record matches the public data. A firm that lists its citations openly, with what it did about each, earns more confidence than one that claims to have none when OSHA's records say otherwise.
Serious injury and fatality potential
Many companies now look beyond total injury counts to events with serious injury or fatality potential: incidents and near misses that could reasonably have killed or permanently disabled someone, whatever the actual outcome. Research in several industries has found that total injury rates can fall for years while serious injuries and deaths stay flat, because the causes of minor injuries, such as cuts and strains, are often different from the causes of fatal ones, such as falls from height, struck-by incidents and contact with energy. A dropped wrench that misses a worker by a meter is a near miss with serious injury potential; a paper cut is not.
On Cottonwood Place, every event with serious injury or fatality potential, whether or not anyone was hurt, was investigated with the same depth as a lost time injury and reported to Tallgrass's vice president of operations within 24 hours. In the first year there were nine such events: three involving dropped objects from upper floors, two involving the crane, two involving excavation edges, and two involving openings, one of them the level 5 fall. That list, not the total recordable rate, drove the priorities in the site plan's revisions.
Owen also shares the site's indicators with the workers themselves. Each month, the site board shows the inspections completed, the deficiencies closed, the near misses reported and what was done about the three most important ones. When workers can see that a near miss they reported led to a new cover, a new rule or a changed sequence, they report more. When the numbers are kept in the office, the people best placed to improve them never see them. The board also shows the number of days since the last event with serious injury potential, but Owen is careful never to present it as a target to be protected, because a counter that workers feel responsible for keeping alive can become one more reason not to report.
Common mistakes
MistakeTreating a low EMR as proof that a contractor is safe on this site.
InsteadCertification and rates show the past and the system on paper; site performance has to be watched.
MistakeComparing injury rates calculated by different methods.
InsteadState the formula and the hours; compare like with like.
MistakeCelebrating a low injury rate over a few months on a small workforce.
InsteadAt small hour totals, one injury swings the rate; look at leading indicators too.
MistakeRewarding supervisors for low injury counts.
InsteadReward leading indicators; injury-count bonuses encourage under-reporting.
MistakeIgnoring a sudden drop in near-miss reports.
InsteadAsk why; it often means workers have stopped reporting.
Summary and key terms
- US contractors certify their programs through OSHA VPP or SHARP, ISO 45001, or prequalification platforms; there is no single national certificate.
- The EMR compares a firm's claim losses with expected losses; 1.0 is average, and many owners screen bidders above 1.0.
- Injury rates use a 200,000-hour base so firms of different sizes can be compared, but small workforces see large swings.
- Lagging indicators measure harm; leading indicators measure the work that prevents it, and good programs track both.
- Numbers used for contracts or bonuses can be manipulated, so they must be audited and never used to discourage reporting.
- EMR
- Experience modification rate: a factor comparing an employer's claim losses with expected losses; 1.0 is average.
- TRIR
- Total recordable incident rate: recordable cases times 200,000, divided by hours worked.
- DART rate
- The rate of cases with days away, restricted work or transfer, per 200,000 hours.
- VPP
- OSHA's Voluntary Protection Programs, recognizing worksites with exemplary safety management.
- ISO 45001
- The international standard for occupational health and safety management systems.
- Leading indicator
- A measure of activities that prevent harm, such as inspections completed.
Practice problems
Work each problem on paper first, then reveal the answer to check.
What does an EMR of 0.80 mean?
Show answer
Claim losses 20 percent below those expected for the employer's size and work, reducing the premium by about 20 percent.
Why can a small firm's EMR swing widely?
Show answer
Because it is based on payroll and losses, so one claim weighs heavily for a small payroll.
Calculate a total recordable rate for 4 recordable cases in 250,000 hours.
Show answer
4 x 200,000 / 250,000 = 3.2.
Give two leading indicators Owen tracks.
Show answer
Any two of: planned inspections completed, deficiencies closed on time, near misses reported, pre-task plans reviewed.
Why does Tallgrass not base supervisor bonuses on injury counts?
Show answer
Because injury-count bonuses encourage under-reporting; it rewards leading indicators instead.
Lesson quiz · 5 questions
Score 60% or more to complete this lesson.
Create a free account to save your progress, take quizzes and earn a certificate.