
CMP-330 · Lesson 12 of 12 · 34 min
Capstone: tracing a web request and measuring network performance
This final lesson brings the course together. First we follow a single, ordinary event, a student opening a laptop on campus and loading a web page, through every layer and protocol we have studied, and build a time budget for it. Then we turn to measurement: how to quantify a network's performance properly, which statistics to report, and how to reason about results with simple laws. We close with the public policy questions that shape networks in Canada and the United States, and with directions for further study. The capstone project at the end asks you to apply all of it to a realistic scenario.
A day in the life of a web request
Ana arrives at the library, opens her laptop and visits her course page. Here is what happens, layer by layer. Her laptop first finds and associates with a Wi-Fi access point, authenticating with WPA3-Enterprise (lesson 11, and CISSP-113 lesson 6). It has no IP address yet, so it broadcasts a DHCP discover message inside a UDP datagram inside an IP datagram from 0.0.0.0 to 255.255.255.255 inside an 802.11 frame. The campus DHCP server, reached through a relay agent on the library's subnet, offers an address, the subnet mask, the default gateway's address and the DNS resolver's address (lesson 8).
To send anything off the subnet, the laptop needs the gateway router's MAC address, so it broadcasts an ARP request and caches the reply (lesson 10). Now it can resolve the page's name: it sends a DNS query in a UDP datagram to the campus resolver, which, if the name is not cached, follows referrals from the TLD servers to the authoritative servers and returns the address (lesson 4). The DNS reply might return an address in a content delivery network rather than the origin server.
With the server's address, the browser opens a TCP connection with a three-way handshake (lesson 7), negotiates TLS 1.3 in one more round trip, and sends an HTTP/2 request; or, if it knows the server supports HTTP/3, it opens a QUIC connection over UDP and saves a round trip (lesson 3). Each packet it sends is encapsulated in TCP or UDP, IP and 802.11 frames (lesson 2). Along the way, the campus switches forward frames by MAC address, the campus routers forward datagrams by longest-prefix match, OSPF has computed the campus routes, and BGP has chosen which of the university's upstream networks carries the traffic to the CDN (lessons 8 and 9). The server's responses ride back over the reverse path, TCP's congestion window grows through slow start, and the browser parses the HTML and fetches dozens of further objects over the same connection.
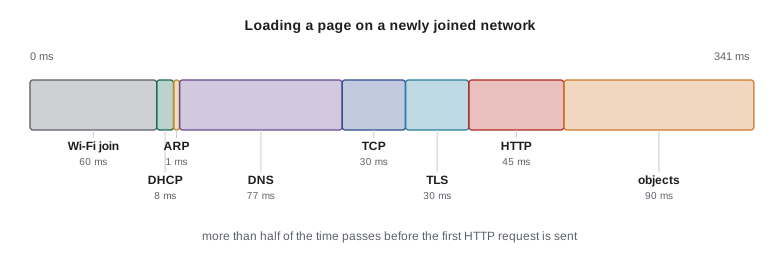
# Time budget for a laptop that joins campus Wi-Fi and loads a page (all times in ms)
steps = [
    ("Wi-Fi association and authentication (WPA3-Enterprise)", 60),
    ("DHCP: discover, offer, request, ack", 8),
    ("ARP for the default gateway", 1),
    ("DNS: resolver cache miss, 2 referrals plus answer", 2 + 3 * 25),
    ("TCP three-way handshake (RTT 30 ms)", 30),
    ("TLS 1.3 handshake", 30),
    ("HTTP request and first byte of HTML (server think time 15 ms)", 30 + 15),
    ("Remaining HTML and 40 objects over HTTP/2 (slow start, 3 more RTTs)", 3 * 30),
]
t = 0
for name, ms in steps:
    t += ms
    print(f"{ms:4d} ms  (total {t:4d})  {name}")
print(f"returning visit on the same network, DNS cached, HTTP/3 with 0-RTT: about {2 + 30 + 15 + 3 * 30} ms")60 ms (total 60) Wi-Fi association and authentication (WPA3-Enterprise) 8 ms (total 68) DHCP: discover, offer, request, ack 1 ms (total 69) ARP for the default gateway 77 ms (total 146) DNS: resolver cache miss, 2 referrals plus answer 30 ms (total 176) TCP three-way handshake (RTT 30 ms) 30 ms (total 206) TLS 1.3 handshake 45 ms (total 251) HTTP request and first byte of HTML (server think time 15 ms) 90 ms (total 341) Remaining HTML and 40 objects over HTTP/2 (slow start, 3 more RTTs) returning visit on the same network, DNS cached, HTTP/3 with 0-RTT: about 137 ms
The budget makes clear where time goes. On a fresh network, joining and resolving take as long as the web transfer itself. The handshakes cost a fixed number of round trips. And even a modest page needs several round trips of data because TCP starts slowly. These numbers explain why browsers keep connections open, cache DNS answers, prefetch names they expect to need, and adopt QUIC with 0-RTT resumption, and why CDNs put servers close to users to shrink every round trip at once.
# How many round trips does TCP slow start need to deliver an object?
import math
def rtts_needed(size_bytes, mss=1460, init_cwnd=10, bdp_segments=None):
    segs = math.ceil(size_bytes / mss)
    cwnd, sent, rtts = init_cwnd, 0, 0
    while sent < segs:
        sent += cwnd; rtts += 1
        cwnd = cwnd * 2 if bdp_segments is None else min(cwnd * 2, bdp_segments)
    return segs, rtts
for size in (14_000, 100_000, 1_000_000, 10_000_000):
    segs, rtts = rtts_needed(size, bdp_segments=2_000)
    print(f"{size/1000:8.0f} KB = {segs:5d} segments: {rtts:2d} RTT(s) of data after the handshakes "
f"({rtts * 30} ms at RTT 30 ms)") 14 KB = 10 segments: 1 RTT(s) of data after the handshakes (30 ms at RTT 30 ms)
100 KB = 69 segments: 3 RTT(s) of data after the handshakes (90 ms at RTT 30 ms)
1000 KB = 685 segments: 7 RTT(s) of data after the handshakes (210 ms at RTT 30 ms)
10000 KB = 6850 segments: 11 RTT(s) of data after the handshakes (330 ms at RTT 30 ms)Worked problem
Diagnosing a slow page
Students in a residence complain that the course website is slow in the evenings but fine in the mornings. Pings to the residence gateway show 2 ms in the morning and 2 to 180 ms in the evening; pings to the web server show 25 ms in the morning and 30 to 210 ms in the evening; the server itself reports normal response times. Where is the problem, and what would you try?
Show solution
- The extra delay already appears on the first hop to the gateway, so it is inside the residence network, not in the internet or the server.
- Large, variable delays at a busy time with no corresponding loss point to queueing: probably a congested uplink or Wi-Fi channel with oversized buffers, which is bufferbloat (lesson 1).
- Check the uplink and the access points' channel utilization; enable active queue management such as FQ-CoDel on the residence router; add capacity or spread users across channels and bands.
- Verify with measurements at the same evening hours after the change, reporting percentiles rather than averages.
Answer: Queueing inside the residence network at peak times; fix it with active queue management, more capacity or better channel planning, and confirm with percentile measurements.
Measuring network performance
Measuring a network well is harder than it looks. The quantities that matter are throughput (how much data per second), latency (one-way delay or round-trip time), jitter (variation in delay), and loss (the fraction of packets that never arrive). Each depends on where and how you measure. Tools such as ping and traceroute measure round-trip time and path; iperf3 measures achievable TCP or UDP throughput between two hosts you control; speed test services measure throughput from a nearby server, which may not be where your application's traffic goes; and packet captures with tcpdump or Wireshark show exactly what happened on the wire, including handshakes, retransmissions and window sizes. Passive monitoring on routers and switches counts bytes, packets, drops and queue lengths over time.
Report distributions, not just averages. Delay distributions are skewed: most packets see a little queueing and a few see a lot. The mean can be dominated by rare bursts, while users notice the tail: a web page that needs 50 requests is only as fast as its slowest few. Engineers therefore report percentiles such as the median (p50), p95 and p99. The program below summarizes synthetic RTT measurements in this way.
import random, statistics
# Summarize measured RTTs the way a monitoring dashboard would
random.seed(313)
base = 28.0
samples = []
for i in range(2_000):
    queue = random.expovariate(1 / 3)                  # queueing delay, mean 3 ms
    if random.random() < 0.01:
        queue += random.uniform(80, 200)               # occasional bursts (bufferbloat)
    samples.append(base + queue)
lost = sum(1 for _ in range(2_000) if random.random() < 0.004)
samples.sort()
pct = lambda p: samples[int(p / 100 * (len(samples) - 1))]
print(f"min {samples[0]:.1f}  median {pct(50):.1f}  mean {statistics.mean(samples):.1f}  "
      f"p95 {pct(95):.1f}  p99 {pct(99):.1f}  max {samples[-1]:.1f} ms")
print(f"loss {lost / 2000:.2%}")
print("the mean is pulled up by rare bursts; percentiles describe what users experience")min 28.0 median 30.2 mean 32.1 p95 37.4 p99 45.0 max 228.1 ms loss 0.45% the mean is pulled up by rare bursts; percentiles describe what users experience
Little's law, which applies to any stable system, relates the average number of items in a system, \(L\), to the arrival rate, \(\lambda\), and the average time each item spends there, \(W\): \(L = \lambda W\). It is a useful sanity check on measurements. For a service, it tells you how many requests are in progress at once; for a TCP connection, it says the data in flight equals throughput multiplied by RTT, the bandwidth–delay product again.
# Little's law: items in a system = arrival rate x time in system
rate = 9_000            # requests per second arriving at a load balancer
latency = 0.120         # seconds each request spends in the system
print("requests in flight:", rate * latency)
# For TCP: data in flight = throughput x RTT (the bandwidth-delay product again)
throughput_bps, rtt = 200e6, 0.045
print(f"bytes in flight at 200 Mbit/s and 45 ms: {throughput_bps * rtt / 8 / 1e6:.2f} MB")requests in flight: 1080.0 bytes in flight at 200 Mbit/s and 45 ms: 1.12 MB
| Symptom | Likely cause | How to check | Lesson |
|---|---|---|---|
| High RTT even when idle | Long path or distant server | traceroute; compare with the speed-of-light floor | 1, 4 |
| RTT rises sharply under load | Queueing and bufferbloat | Ping while transferring; look for delay growth | 1, 7 |
| Throughput far below link rate on a long path | Window too small for the bandwidth–delay product | Capture and check receive window and window scaling | 1, 7 |
| Many retransmissions | Loss from congestion or a bad link | Interface error counters; tcpdump; loss with ping | 6, 7, 10 |
| Large transfers hang after the handshake | Path MTU problem with blocked ICMP | Try smaller packets; check firewall ICMP rules | 8 |
| Slow first load, fast reloads | DNS resolution and handshakes dominate | Browser developer tools timing breakdown | 3, 4 |
Network policy: who decides how the internet works?
Networks are shaped by law and regulation as well as by engineering. Three issues stand out: network neutrality, broadband access and spectrum, the last of which lesson 11 discussed. The details differ between countries, and they change; what follows describes the situation as of late 2026.
In the United States, network neutrality has swung back and forth with changes of administration. The FCC adopted net neutrality rules in 2015, repealed them in 2017, and restored them in 2024 by classifying broadband as a telecommunications service under Title II of the Communications Act. In January 2025 the Sixth Circuit Court of Appeals set the 2024 order aside, holding that broadband is an information service that the FCC cannot regulate in that way, so there are now no federal net neutrality rules; several states, including California and Washington, have their own laws. On access, the 42.5-billion-dollar Broadband Equity, Access, and Deployment (BEAD) program, created by the 2021 infrastructure law, was restructured by the NTIA in June 2025 to make it technology-neutral, so that satellite and fixed wireless compete with fiber for subsidies, and states revised their plans accordingly; rural and tribal areas remain the hardest to serve.
Arguments about neutrality reflect real trade-offs. Supporters argue that ISPs with local market power should not be able to favor their own services or charge content providers for access to customers, which could entrench incumbents and harm innovation. Opponents argue that heavy regulation discourages investment in networks, that competition and transparency are enough, and that some traffic differentiation, for example for emergency services or low-latency applications, is beneficial. Engineers contribute evidence on what traffic management is technically necessary and how it can be detected and measured.
Worked problem
Is this traffic management reasonable?
An ISP proposes three practices: (a) during evening congestion, giving every user an equal share of the congested link; (b) exempting its own video service from customers' monthly data caps; (c) slowing all traffic to a competing video service. Evaluate each from the engineering and policy perspectives of this course, without assuming a particular legal outcome.
Show solution
- (a) Per-user fair queueing at a congested link is application-agnostic and transparent; it resembles the fair-share goal of lesson 7 and is generally treated as reasonable traffic management.
- (b) Zero-rating its own service favors one application by price rather than by engineering need; Canadian rules on differential pricing generally prohibit it, and it has been controversial in the United States.
- (c) Throttling a competitor targets a specific application with no technical justification; it would be widely viewed as discrimination and is the core concern of neutrality advocates.
- Measurement tools that compare throughput for different services over the same path can detect practices such as (c).
Answer: (a) is generally acceptable application-agnostic management; (b) and (c) favor or disfavour particular services and raise serious neutrality concerns, with (c) the most clearly discriminatory.
Where to go next
This course has covered the core of computer networking, but each lesson opens onto a larger field. CMPUT-331 covers network and computer security in depth, including the attacks and defenses that this course mentioned only briefly. CMPUT-404 builds web applications and their architectures on top of HTTP. CMPUT-450 studies distributed systems: how many machines connected by an unreliable network can agree, replicate data and tolerate failures. CMPUT-379 explains how operating systems implement sockets, protocol stacks and the scheduling behind them. And research continues on many fronts: congestion control for very high speeds and low latency, programmable data planes, satellite constellations in low Earth orbit, 6G cellular, and networks for machine learning clusters, where thousands of accelerators exchange data at terabits per second.
The capstone project
The capstone asks you to analyze and improve the network experience of a realistic, invented client: the Riverbend Robotics Club, a non-profit with a workshop, a public demonstration hall and a cloud-hosted website that streams live robot competitions. You will draw a diagram of the club's network with addressing, VLANs and Wi-Fi channels (lessons 8, 10 and 11); write a socket program that measures round-trip time and throughput to a test server you run locally (lesson 5); build a time budget for a visitor loading the competition page, including DNS, handshakes and slow start (lessons 3, 4 and 7); simulate the live stream's adaptive bitrate behavior on a congested Wi-Fi network (lessons 4 and 11); recommend changes such as a CDN, HTTP/3, active queue management and channel planning; and present your measurements as percentiles with a clear account of their limitations.
Worked problem
Capstone sample: sizing the hall's Wi-Fi
The demonstration hall will hold 300 visitors, of whom about 60% will be on Wi-Fi at once, each watching a 720p stream at 3 Mbit/s. Each access point delivers about 300 Mbit/s of real throughput per 80 MHz channel on 5 or 6 GHz when shared. How many access points and non-overlapping channels are needed, and what other design choices help?
Show solution
- Demand: \(300 \times 0.6 \times 3 = 540\) Mbit/s.
- With a 50% safety margin for overhead, retransmissions and uneven distribution: about 810 Mbit/s, so at least \(\lceil 810/300 \rceil = 3\) access points.
- Use separate non-overlapping channels for each AP (the 6 GHz band offers several 80 MHz channels), reduce transmit power so that cells do not overlap excessively, and steer capable devices to 5 and 6 GHz.
- Put the live stream on the CDN rather than the club's own uplink, and give the hall its own VLAN and SSID separate from the workshop network.
Answer: At least three access points on separate 80 MHz channels, with power tuning, band steering, CDN delivery of the stream and a separate visitor VLAN.
Common mistakes
MistakeReporting only the average latency.
InsteadDelay is skewed; report percentiles such as p50, p95 and p99 alongside the mean.
MistakeTrusting a single speed test to diagnose an application's problem.
InsteadSpeed tests measure one path at one moment; measure along the application's real path, repeatedly.
MistakeIgnoring DNS and connection setup when estimating page load time.
InsteadOn new networks, resolution and handshakes can cost as much as the data transfer.
MistakeAssuming the problem is far away.
InsteadMeasure hop by hop; many problems sit in the local Wi-Fi or access link.
MistakeTreating network policy as purely legal.
InsteadEngineering evidence about traffic management and measurement informs policy debates.
MistakeForgetting Little's law when sizing systems.
InsteadIn-flight work equals arrival rate times time in system, a quick check on capacity plans.
Summary and key terms
- Loading one page on a new network involves Wi-Fi association, DHCP, ARP, DNS, TCP or QUIC, TLS, HTTP, switching, routing and BGP.
- Round trips for setup and slow start often dominate page load time on short transfers.
- Key metrics are throughput, latency, jitter and loss, measured with ping, traceroute, iperf3, packet captures and monitoring.
- Delay distributions are skewed, so percentiles describe user experience better than means.
- Little's law links in-flight items, arrival rate and time in system, including the bandwidth–delay product.
- Network neutrality, broadband access and spectrum policy shape networks; Canadian and American approaches differ and change over time.
- Further study continues in security, web applications, distributed systems and operating systems.
- Time budget
- A breakdown of how long each step of an operation takes.
- Jitter
- Variation in packet delay over time.
- Percentile
- The value below which a given percentage of measurements fall, such as p95.
- Little's law
- In a stable system, the average number of items equals arrival rate times average time in system.
- iperf3
- A tool for measuring achievable throughput between two hosts.
- Packet capture
- A recording of the packets on a link, analyzed with tools such as Wireshark.
- Network neutrality
- The principle that ISPs should not discriminate among lawful traffic by source, destination or application.
- Zero-rating
- Exempting selected services from a customer's data cap.
- Active queue management
- Router algorithms that drop or mark packets early to keep queues short.
- Bandwidth–delay product
- Throughput times RTT: the data in flight on a connection, an instance of Little's law.
Practice problems
Work each problem on paper first, then reveal the answer to check.
List, in order, the protocols a newly joined laptop uses before it can send an HTTP request to a named server.
Show answer
Wi-Fi association, DHCP, ARP for the gateway, DNS, then TCP and TLS (or QUIC).
Why might the DNS answer for a website point to a CDN rather than the origin?
Show answer
The CDN's DNS returns a nearby cache to reduce delay and origin load.
How many round trips of data does slow start need for 100 KB with an initial window of 10 segments?
Show answer
Three: 10 + 20 + 40 = 70 segments cover the 69 needed.
Why report p99 latency?
Show answer
It captures the tail that users of many-request pages experience.
A server handles 2,000 requests per second, each taking 50 ms. How many are in progress on average?
Show answer
100, by Little's law.
What does a sharp rise in RTT to the first hop under load suggest?
Show answer
Queueing, often bufferbloat, in the local network.
Which tool would you use to see TCP window sizes and retransmissions?
Show answer
A packet capture with tcpdump or Wireshark.
What is zero-rating?
Show answer
Exempting selected services from data caps.
Name one course that continues from this one and its focus.
Show answer
CMPUT-331, network and computer security (or CMPUT-404, CMPUT-450, CMPUT-379).
Why should measurements be repeated at different times?
Show answer
Network conditions change with load, so a single measurement may not be representative.
Lesson quiz · 5 questions
Score 60% or more to complete this lesson.
Create a free account to save your progress, take quizzes and earn a certificate.