
CHE-380 · Lesson 11 of 12 · 21 min
Risk assessment
Hazard identification tells a team what can go wrong. Risk assessment asks how likely each outcome is and how bad it would be, and whether the combination is acceptable. Risk combines frequency and consequence. A frequent event with minor consequences and a rare event with catastrophic consequences can carry similar risk, but they call for different responses. This lesson covers the tools used to estimate frequencies, fault trees and event trees; the ways risk is expressed, as individual risk and societal risk; the criteria used to judge it; and how layer of protection analysis, which Theo used in CHE-374, fits into the picture. The worked example is the overfilling of tank T-402, a scenario that the HAZOP of lesson 10 flagged for further study.
Qualitative and quantitative risk
Most hazards at a plant are assessed qualitatively, with a risk matrix that ranks frequency and severity in categories such as rare to frequent and minor to catastrophic. The matrix assigns each scenario to a cell, and the cells are colored to show whether the risk is acceptable, needs reduction where practicable, or is intolerable. Matrices are quick and help a team agree, but they are coarse, and different people can place the same scenario in different cells. Where a scenario lands near the boundary of a high-risk cell, or where large consequences are possible, the analysis moves to semi-quantitative methods such as LOPA or to full quantitative risk assessment, QRA.
Fault trees
A fault tree works backward from an undesired top event to the combinations of failures that could cause it. Events are linked by logic gates. An OR gate means that any one of its input events causes the output; for independent events with small probabilities, the output frequency is approximately the sum of the inputs. An AND gate means that all inputs must occur together; the output is the product. Fault trees mix frequencies, such as failures per year, with probabilities, such as the chance that a safety device fails on demand. A frequency can be multiplied by probabilities, but two frequencies cannot be multiplied together.
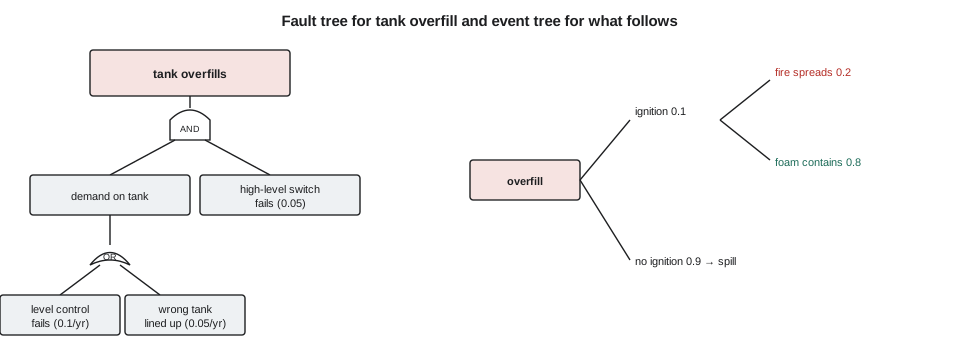
For tank T-402, overfilling needs a demand and a failed safeguard. The demand comes from either the level control loop failing, about 0.1 per year, or an operator lining up the transfer to the wrong tank, about 0.05 per year. The safeguard is a high-level switch that should stop the transfer pump; it fails on demand with probability 0.05. The OR gate gives a demand frequency of about 0.145 per year, and the AND gate with the switch gives an overfill frequency of about 0.0073 per year, or once in about 140 years.
Event trees
An event tree works forward from an initiating event, branching at each point where a safeguard succeeds or fails or where a physical outcome is uncertain. Each branch has a probability, and the frequency of each outcome is the initiating frequency multiplied by the probabilities along its path. For the overfill, the first branch is whether the spilled ethyl acetate ignites, taken as 0.1 for a well-controlled tank farm. If it ignites, the second branch is whether the foam system contains the fire, taken as 0.8.
# Fault tree, event tree, individual risk and an F-N check (all frequencies illustrative)
# Fault tree: overfill of T-402 = (level control fails OR operator lines up wrong tank) AND high-level switch fails
p_lc, p_op, p_hls = 0.1, 0.05, 0.05      # per year, per year, probability on demand
top = (1 - (1 - p_lc) * (1 - p_op)) * p_hls
print(f"overfill frequency: {top:.4f} per year (OR gate {1 - (1 - p_lc) * (1 - p_op):.3f}, then AND with switch)")
# Event tree after an overfill: ignition, then whether the fire escalates
outcomes = []
for ign, pi in (("ignition", 0.1), ("no ignition", 0.9)):
    if ign == "ignition":
        for esc, pe in (("fire spreads to tank farm", 0.2), ("contained by foam system", 0.8)):
            outcomes.append((f"{ign}, {esc}", top * pi * pe))
    else: outcomes.append((f"{ign}: spill cleaned up", top * pi))
for name, f in outcomes: print(f"{f:9.2e} /yr  {name}")
# Individual risk at a fence line from three scenarios: sum of f x probability of fatality at that point
scen = ((outcomes[0][1], 0.3), (1e-5, 0.5), (2e-6, 0.9))
ir = sum(f * p for f, p in scen)
print(f"individual risk at the east fence: {ir:.1e} per year")
for lim, use in ((1e-4, "no other land use"), (1e-5, "manufacturing, warehouses, open space"), (1e-6, "commercial, low-density residential"), (0.0, "all uses incl. sensitive")):
    if ir >= lim: print(f"-> falls in the band permitting: {use}"); break
# F-N check: frequency of N or more fatalities against a line F = 1e-3 / N^2
for N, F in ((1, 3e-5), (3, 6e-6), (10, 1.5e-6)):
print(f"N >= {N:2d}: F = {F:.1e}, criterion {1e-3 / N ** 2:.1e} -> {'below' if F < 1e-3 / N ** 2 else 'ABOVE'}")overfill frequency: 0.0073 per year (OR gate 0.145, then AND with switch) 1.45e-04 /yr ignition, fire spreads to tank farm 5.80e-04 /yr ignition, contained by foam system 6.53e-03 /yr no ignition: spill cleaned up individual risk at the east fence: 5.0e-05 per year -> falls in the band permitting: manufacturing, warehouses, open space N >= 1: F = 3.0e-05, criterion 1.0e-03 -> below N >= 3: F = 6.0e-06, criterion 1.1e-04 -> below N >= 10: F = 1.5e-06, criterion 1.0e-05 -> below
The event tree gives three outcomes: a fire that spreads to the tank farm at about \(1.5 \times 10^{-4}\) per year, a fire contained by the foam system at about \(5.8 \times 10^{-4}\) per year, and a spill without ignition at about \(6.5 \times 10^{-3}\) per year. The last is the most likely but the least severe; it is an environmental and cleanup event. The first is the least likely but could involve fatalities and the loss of several tanks. The analysis shows where to act: the most effective change is to make overfill less likely, because every downstream outcome scales with it.
Worked problem
Combining gates
A pump seal leak occurs 0.2 times a year. A gas detector, which fails on demand with probability 0.1, should trip the pump. If the detector fails, ignition follows with probability 0.05. What is the frequency of a fire?
Show solution
- Leak and detector failure: \(0.2 \times 0.1 = 0.02\) per year.
- Ignition: \(0.02 \times 0.05 = 0.001\) per year.
Answer: About once in 1,000 years.
Individual and societal risk
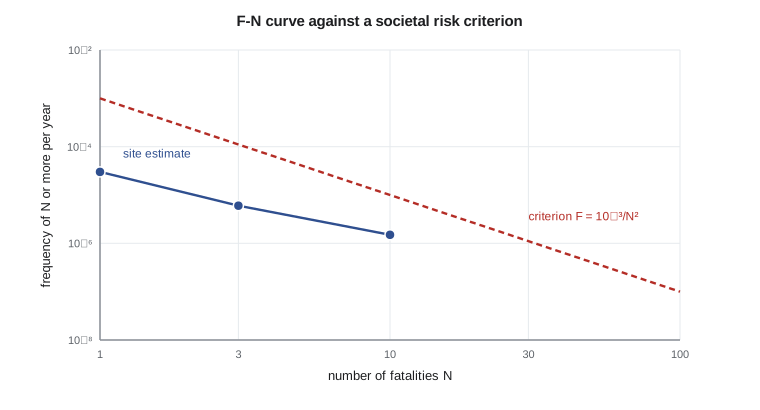
Two measures express risk to people. Individual risk is the frequency with which a hypothetical person at a given location would be killed by the plant's hazards, usually assuming they are present all the time and unprotected. It is calculated by summing, over all scenarios, the frequency of each outcome multiplied by the probability that it would be fatal at that location. It is drawn as contours on a site map. Societal risk considers how many people could be harmed at once. It is plotted as an F-N curve: the frequency \(F\) of events causing \(N\) or more fatalities, against \(N\), on log scales. Society tends to be more averse to a single event killing many people than to many events killing one each, so F-N criteria usually slope downward more steeply than one-for-one.
For the east fence of the tank farm, adjacent to a warehouse owned by another company, three scenarios contribute: the spreading tank fire, a pool fire from a loading hose failure, and a flash fire from a large release. Their combined individual risk is about \(5 \times 10^{-5}\) per year. On an F-N plot, the plant's estimates fall below an illustrative criterion line of \(F = 10^{-3}/N^2\).
Risk criteria
Whether a risk is tolerable is a societal judgment, not an engineering result. In Iowa the reference for land use near hazardous facilities is guidance from the Center for Chemical Process Safety, since there are no federal numerical risk criteria in the US. The criteria were developed by the Major Industrial Accidents Council of Canada and are usually summarized as bands of annual individual risk: above about \(10^{-4}\), no other land use; between \(10^{-4}\) and \(10^{-5}\), uses such as manufacturing, warehouses and open space; between \(10^{-5}\) and \(10^{-6}\), commercial and low-density residential uses; and below about \(10^{-6}\), all uses including high-density residential and sensitive institutions such as schools and hospitals. The plant's \(5 \times 10^{-5}\) at the east fence falls in the band that permits warehouses, which is consistent with the neighboring land use.
Many companies also set internal criteria for their own workers, such as a maximum individual risk of \(10^{-3}\) per year for the most exposed worker and a target of \(10^{-4}\) or lower, together with the principle that risks should be reduced as low as reasonably practicable, ALARP. Under ALARP, a risk in the tolerable band must still be reduced if the cost of doing so is not grossly disproportionate to the benefit. The company's LOPA targets in CHE-374 came from such criteria, translated into tolerable frequencies for each severity of consequence.
| Annual individual risk | Land uses commonly permitted |
|---|---|
| above about \(10^{-4}\) | No other land use |
| \(10^{-4}\) to \(10^{-5}\) | Manufacturing, warehouses, open space |
| \(10^{-5}\) to \(10^{-6}\) | Commercial, low-density residential |
| below about \(10^{-6}\) | All uses, including high-density residential and institutions |
Where the frequencies come from
The numbers in fault trees and event trees come from several sources. Equipment failure rates are taken from industry databases compiled from many plants, from manufacturers' data and from the company's own records; they are usually given as failures per year or per hour, divided into dangerous and safe failures. Human error probabilities come from human reliability studies, which suggest values of about one in a hundred for a routine, well-practiced task done under good conditions, rising to one in ten or worse under stress, time pressure or poor design. Ignition probabilities depend on the size of the release and the number of ignition sources nearby; published correlations relate them to release rate. Each source carries uncertainty, often a factor of three to ten. A frequency estimate built from several such numbers is best treated as an order of magnitude.
Common-cause failures deserve special attention. Two safeguards that look independent on paper may fail together if they share a power supply, an instrument air header, a maintenance crew or a design error. In the fault tree for T-402, the high-level switch and the level transmitter are on separate supplies, but both were calibrated against the same tank strapping table. An error in that table would affect both, so the team adds a check of the strapping table to the startup verification.
Uncertainty is not a reason to avoid numbers. Even rough estimates show which scenarios dominate the risk and which safeguards matter most. A useful habit is to ask how the decision would change if a key frequency were ten times higher or lower. If the answer is not at all, the estimate is good enough; if the decision flips, the scenario needs better data or a more robust design.
LOPA and QRA
Layer of protection analysis sits between the risk matrix and full QRA. It takes one scenario from a HAZOP, starts with an initiating event frequency, multiplies by the probability of failure on demand of each independent protection layer and by conditional modifiers such as the probability of ignition, and compares the result with a tolerable frequency. LOPA uses order-of-magnitude values and conservative rules, so it is quick and consistent, and it tells the team how much additional protection is needed, often expressed as a safety integrity level for a new instrumented function. Full QRA combines many scenarios, consequence models and weather data to produce risk contours and F-N curves; it is used for siting decisions, land-use planning and major hazard facilities. Both methods rest on frequency data whose uncertainty can be a factor of ten, so their results guide decisions rather than certify safety.
Common mistakes
MistakeMultiplying two frequencies together in a fault tree.
InsteadMultiply a frequency only by probabilities; an AND of two frequencies needs a time window.
MistakeTreating the most likely outcome as the most important.
InsteadWeigh likelihood against severity; rare severe events may dominate risk.
MistakePresenting QRA results to two significant figures.
InsteadReport orders of magnitude and the main uncertainties.
MistakeStopping once a risk is in the tolerable band.
InsteadApply ALARP: reduce further where it is reasonably practicable.
Summary and key terms
- Risk combines frequency and consequence.
- Fault trees: OR adds frequencies, AND multiplies by probabilities; the T-402 overfill is about 0.0073 per year.
- Event trees branch from an initiating event; a spreading tank fire comes out at about \(1.5 \times 10^{-4}\) per year.
- Individual risk at the east fence is about \(5 \times 10^{-5}\) per year, consistent with warehouse use under the MIACC bands.
- Societal risk uses F-N curves; LOPA and QRA support decisions under large uncertainty.
- Fault tree
- A diagram tracing a top event back to combinations of basic failures through logic gates.
- Event tree
- A diagram tracing an initiating event forward through branches to outcomes.
- Individual risk
- The annual frequency of fatality for a person at a given location.
- Societal risk
- The relationship between the frequency and the number of people harmed.
- F-N curve
- A plot of the frequency of N or more fatalities against N.
- ALARP
- As low as reasonably practicable: reduce risk unless the cost is grossly disproportionate.
Practice problems
Work each problem on paper first, then reveal the answer to check.
An OR gate has inputs of 0.02 and 0.03 per year. Estimate the output.
Show answer
About 0.05 per year.
An initiating event of 0.5 per year meets two layers with PFDs 0.1 and 0.01. Mitigated frequency?
Show answer
\(5 \times 10^{-4}\) per year.
Why is the most likely outcome of the overfill not the main concern?
Show answer
Its consequence, an unignited spill, is the least severe.
Individual risk at a site boundary is \(3 \times 10^{-6}\). Which uses are commonly permitted?
Show answer
Commercial and low-density residential.
What does a steep F-N criterion line express?
Show answer
Aversion to events that kill many people at once.
What is the main limitation of QRA results?
Show answer
Large uncertainty in frequency data and models.
Lesson quiz · 5 questions
Score 60% or more to complete this lesson.
Create a free account to save your progress, take quizzes and earn a certificate.